Observability
Watching a workflow run — the Workflow SDK's inspector UI (pnpm workflow:ui) and Airwave's own in-app run pages backed by trace tables.
A durable run is worth watching, and there are two surfaces for it: the Workflow SDK's own inspector (a developer tool over the raw run/step/event data), and Airwave's in-app run pages (the admin-facing view that adds what WDK structurally can't see — the inside of a step, and honest cost). Most of the time you want the in-app pages; the inspector is for low-level debugging.
The Workflow SDK inspector — pnpm workflow:ui
The SDK ships an observability web UI that reads straight from Airwave's Postgres world: runs, steps, events, and live streams. Launch it on its own with:
pnpm workflow:uiThat runs bunx workflow inspect runs --web and serves the UI at
http://localhost:3199?resource=run (override the port with WORKFLOW_UI_PORT). It is a long-lived,
persistent process, deliberately kept separate from pnpm dev — start it only when you want to
watch a run. (pnpm dev does already start it for you; the standalone script,
apps/server/scripts/workflow-ui.ts, is for inspecting a run made without a dev server — e.g. one
kicked off by scripts/run-lineup.ts.)
The inspector shows every run keyed by WDK's workflowRunId, its step timeline, and the raw event
stream, and it updates live — so you can dispatch a build and watch step_created /
step_started / completion events land as the fan-out progresses. Because it reads the world
directly, it sees a run whether or not the Airwave admin UI is open.
Node flag gotcha. The inspector imports
node:sqlite, which Node keeps behind--experimental-sqliteuntil Node 23 (Airwave is on 22.12). The launcher script setsNODE_OPTIONS=--experimental-sqlitefor exactly this reason — without it the server prints "started" and then 500s every request withERR_UNKNOWN_BUILTIN_MODULE. Usepnpm workflow:uirather than invoking the CLI directly and you inherit the flag.
Airwave's in-app run pages
WDK persists every step's input and output already, but two things it structurally cannot capture
drove Airwave to add its own run pages in the admin UI (under
apps/web/src/routes/_auth/settings/workflows/):
- The inside of a step. A channel build is one step wrapping a whole model tool-loop. Its previews, filter revisions, and reasoning are invisible from the outside — and that is precisely the part worth reading.
- Honest cost. WDK's own totals only reflect steps that succeeded, which understates a run three ways: the planner call (on a pricier model) is never counted, retries look free, and everything is priced at worker rates.
So each workflow gets a card on the Settings → Workflows index (one per workflow, with run counts) and a per-run detail page that live-polls while a run is in flight, correlating WDK's step metadata with Airwave's own trace rows.
What the run page shows
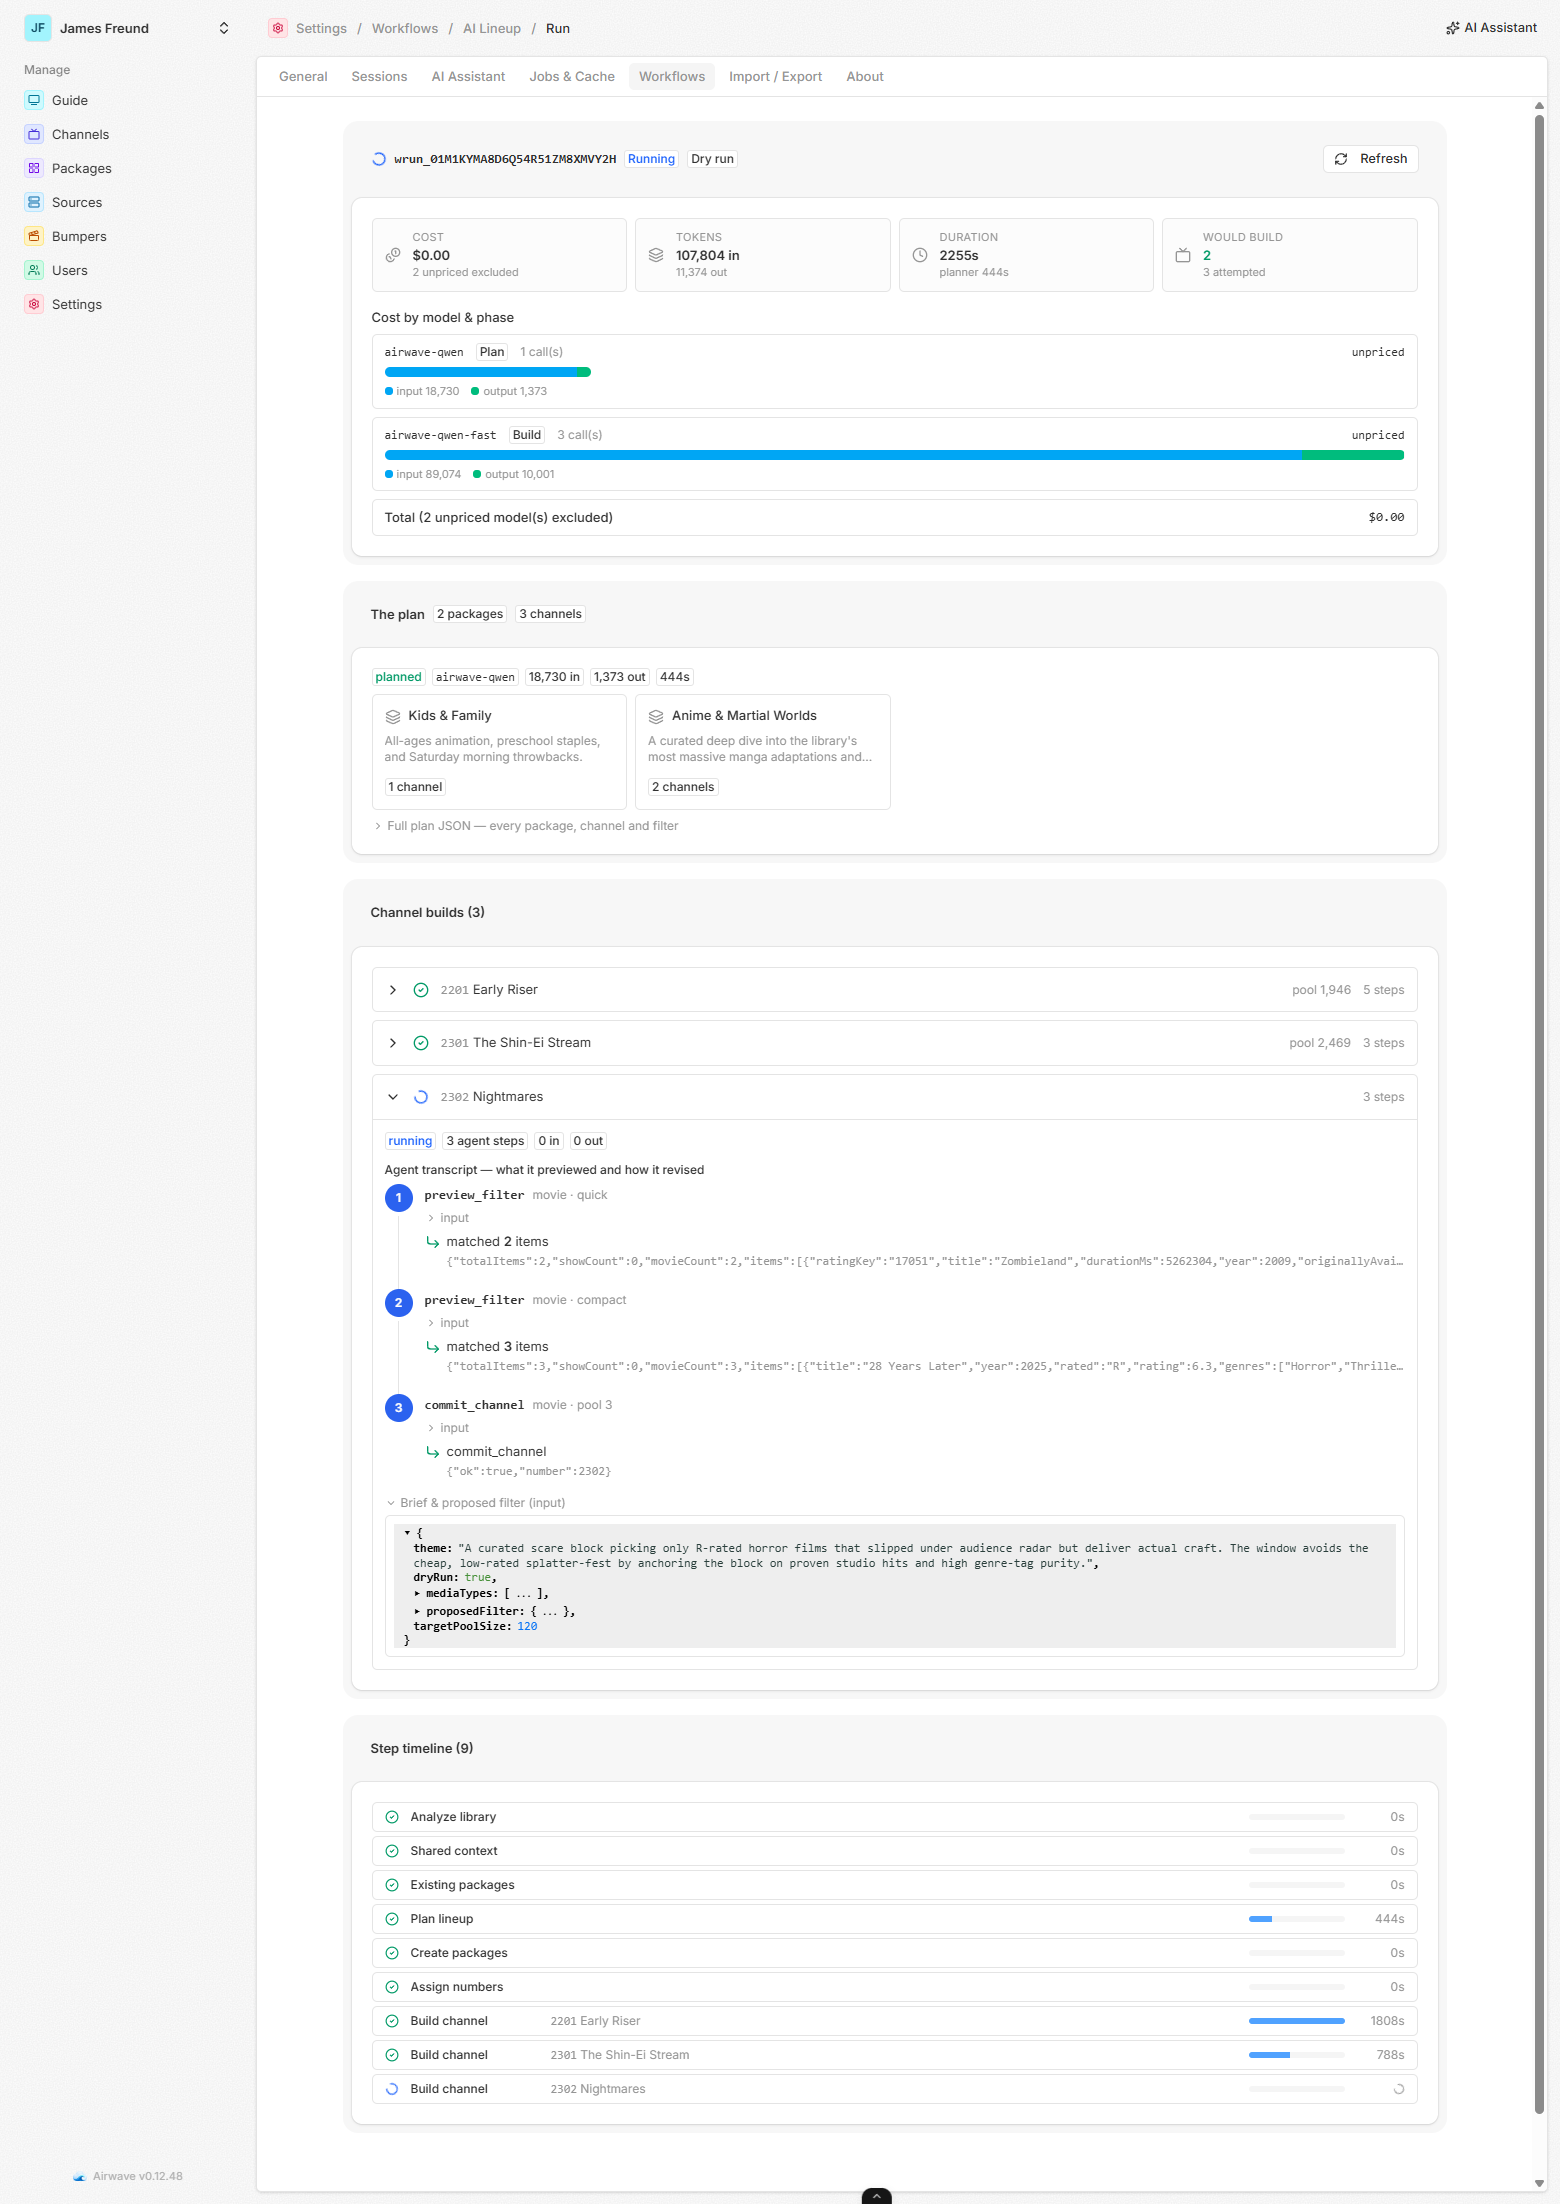
The AI lineup run page reads at a glance and fills in live as the run works — each build now streams its trace in as it happens, rather than appearing only when the step ends:
- Headline tiles — total cost, tokens in/out, wall-clock duration (with the planner's time called out), and channels created / would-build, plus Running and Dry run badges on live/preview runs.
- Cost by model & phase — a stacked token bar per model (uncached input · cache-read · cache-write · output) with hover tooltips and colour swatches, so a run's real spend — planner and workers, retries included — is one glance. Unpriced local models are shown as such rather than guessed.
- The plan — the packages/channels as hovercard tiles (hover for the channel list) plus the full plan JSON in an interactive tree.
- Channel builds — each build is a numbered agent transcript: the
preview_filter→ refine →commit_channeltool loop rendered as readable steps (the model's reasoning as markdown), with an attempt switcher when a build retried, and Brief/Outcome as expandable JSON. - Step timeline — the SDK's outside view: per-step status, duration bars, retries, and (for builds) the channel each step was for. Clicking a step jumps to and opens the matching build or the plan.
- Auto-refresh toggle — polling is on by default; flip it off (next to Refresh) to stop the background requests and update only on demand.
The trace tables
The extra detail comes from two Prisma tables in the public schema, written best-effort from inside
each step:
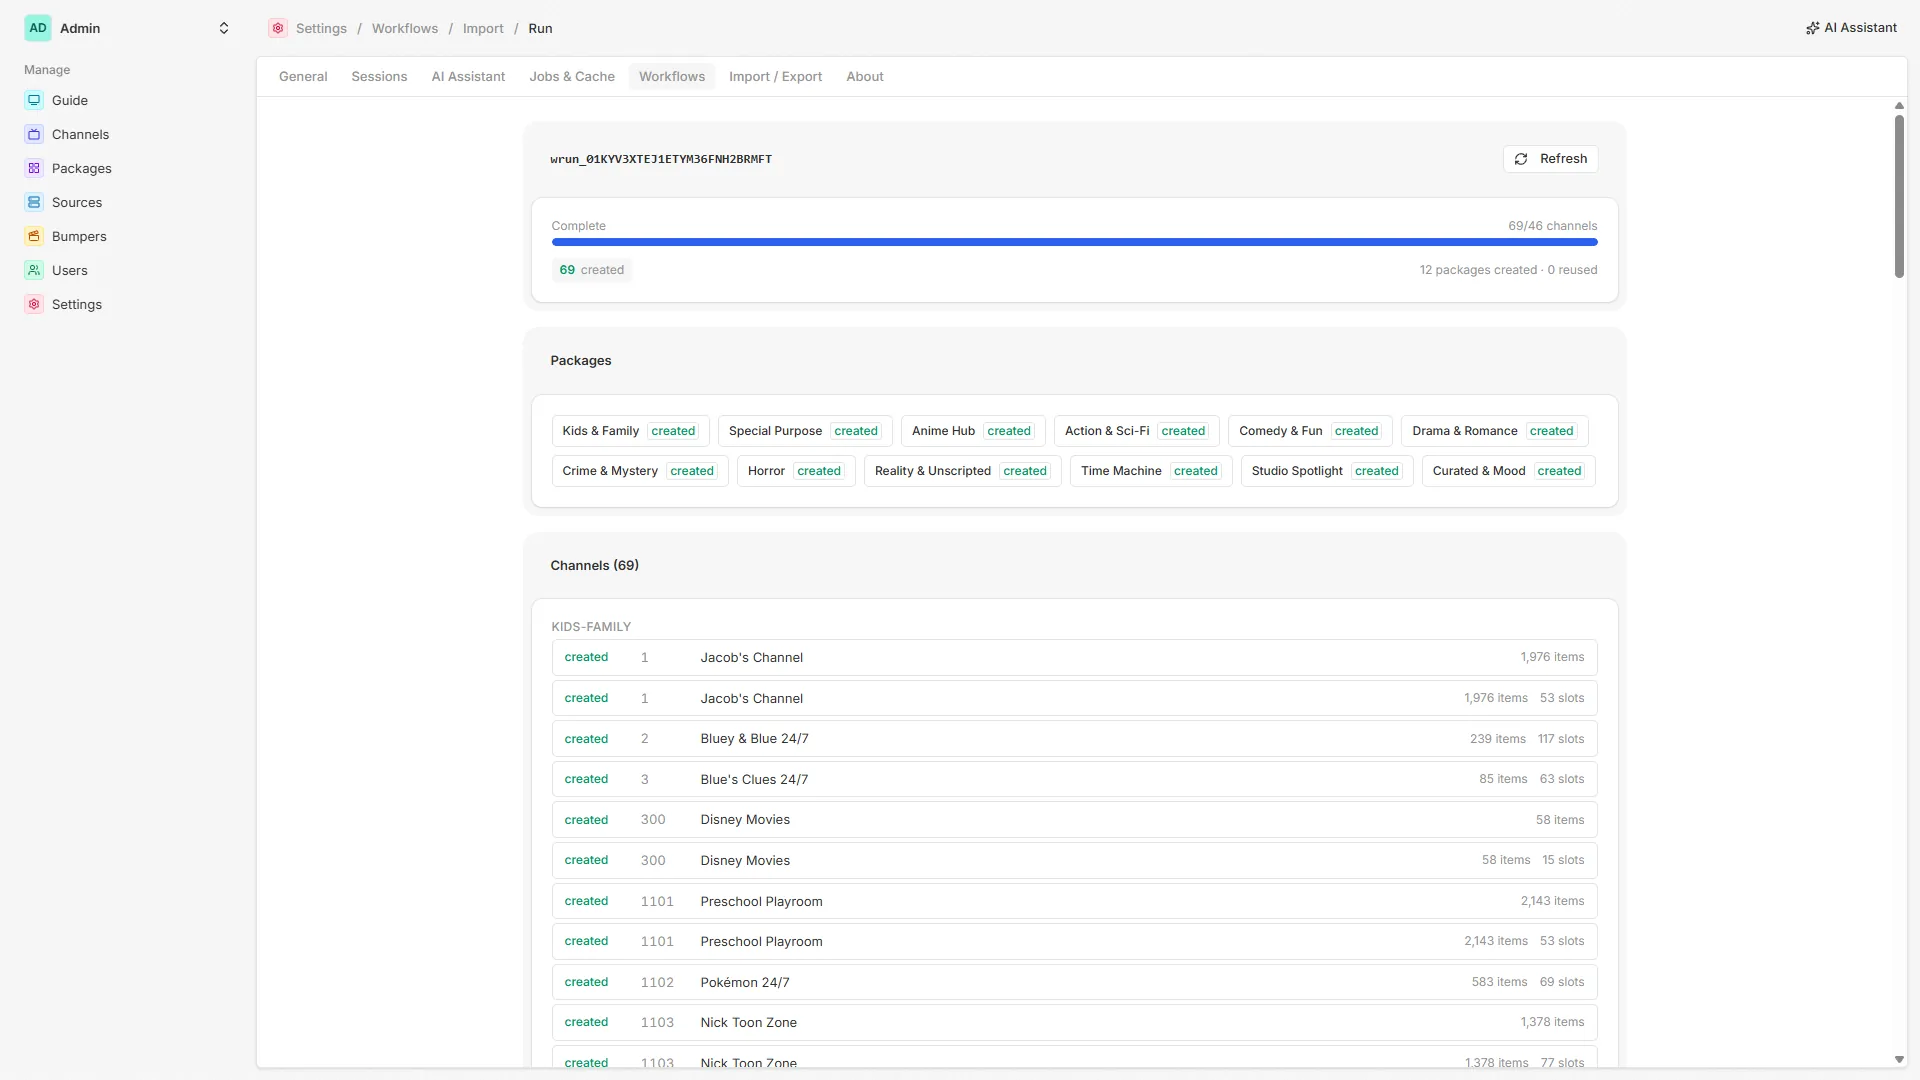
AiLineupTrace(ai_lineup_trace), written byrecordTrace. Captures per-attempt phase (analyze/context/plan/packages/numbering/build/report), status and reason, the summarized input/output, the agent's tool-call trace, and per-model token usage (input, output, cache read/write, agent steps).ImportTrace(import_trace), written byrecordImportTrace. Trimmed — no AI, no tokens — so it records per-package/per-channel outcomes (created / skipped / disabled / failed), the resolved pool size, the reassigned number, and thedryRunflag the run page banners.
Three design points shared by both:
- Keyed by WDK's own ids —
workflowRunIdplusstepId/attempt— so a trace row joins back onto the step timeline. Those ids are read inside the workflow and handed down to the service, so thatpackages/apinever imports the Workflow SDK — the dependency inversion that keeps the services usable, and the server bootable, with the engine off. attemptis load-bearing. A retried step writes a second row instead of overwriting, which is what finally makes retries visible in the cost accounting.- Recording is best-effort. Every write is wrapped so a trace failure can never fail an otherwise-successful, expensive step; payloads are JSON-normalized and size-capped.
How the run pages read WDK
Because the runs themselves live in WDK's workflow schema — invisible to Prisma — the read models
(lineup-runs.ts, import-runs.ts) read run and step metadata via raw SQL over the same
connection: workflow.workflow_runs left-joined to workflow.workflow_steps, filtered by workflow
name (LIKE '%aiLineupWorkflow%' / '%importLineupWorkflow%'). A run's return value — the
LineupReport with token totals — is stored as CBOR in output_cbor, so decoding it goes back
through the SDK via getRun().returnValue.
Watching a run in progress
- In the admin UI: open Settings → Workflows, pick the workflow, and open the run — the detail page live-polls, so steps and per-channel traces fill in as the fan-out completes. This is the view that shows token cost and the inside of each build.
- In the inspector: run
pnpm workflow:uiand openhttp://localhost:3199?resource=runto watch the raw runs / steps / events / streams update live. Reach for this when you need the low-level event timeline (e.g. spotting re-dispatched fan-out steps) rather than the curated admin view.
Source map
| Concern | File |
|---|---|
Inspector launcher (pnpm workflow:ui) | apps/server/scripts/workflow-ui.ts |
workflow:ui turbo task | turbo.json, apps/server/package.json |
| AI lineup trace writer | packages/api/src/services/agent/lineup-trace.ts |
| Import trace writer | packages/api/src/services/transfer/import-trace.ts |
Run read models (raw SQL over workflow.*) | packages/api/src/services/agent/lineup-runs.ts, transfer/import-runs.ts |
| Trace table models | packages/db/prisma/schema/ai.prisma, transfer.prisma |
| Admin run pages | apps/web/src/routes/_auth/settings/workflows/ |
| Decode a run's return value | apps/server/src/workflow-engine.ts (getRun().returnValue) |
See also: The AI lineup builder · The importer · Durable workflows overview.
The importer
The durable Import workflow — how an uploaded lineup is deduped, numbered, and rebuilt against your own media server, with an end-to-end dry-run that skips every write.
Device capability diagnostic
Measuring what a device can actually decode instead of cataloging device profiles — and how that drives direct-play vs transcode.